Samotsvety probabilities for potential precursors of existential risk
Seven Samotsvety forecasters give their probabilities for different possible catastrophes to lead to more than 1M direct deaths in any one year, in any of the next 10 years. This post presents results, starting with a table which presents the probabilities, continuing with a discussion of each of the items, and concluding with some thoughts on relevance for Sentinel’s work averting or mitigating incipient catastrophes.
Some forecasters found some questions in particular much more interesting, so we alternate between presenting the probability of the best model when one such exists, and the geometric mean of the odds when it’s a risk that requires more subjective judgment and we have enough judgments to aggregate. Events that could fall into different buckets resolve each buckets. For instance, an AI-invented biological weapon used during WW3 would resolve the “AI”, “biological weapons” and “WW3” buckets.
Summary plot and table

| Calamity | Probability > 1M deaths in a year of the next 10 | Range1 | estimate |
|---|---|---|---|
| War | 23% | 18% to 40% | Forecaster aggregate |
| Natural pandemic | 22% | 10% to 30% | Forecaster aggregate |
| The unexpected | 21% | 15% to 30% | Forecaster aggregate |
| WW3 specifically | 12% | 5% to 40% | Forecaster aggregate |
| AI | 10% | 1% to 40% | Forecaster aggregate |
| Unintentional biochem | 2.4% | 0.8% to 10% | Forecaster aggregate |
| Biological weapons | 2.2% | 2% to 2.5% | Forecaster aggregate |
| Climate change | 2.5% | 1% to 5% | Forecaster aggregate |
| Volcanoes | 1% | 0.2% to 2% | Best model |
| US civil war | 0.92% | 0.05% to 3% | Forecaster aggregate |
| Financial crisis | 0.59% | 0.2% to 2% | Forecaster aggregate |
| Solar storm | 0.2% | 0.00066% to 0.71% | Best model |
| Simulation shutdown | 0.13% | 0.001% to 3% | Forecaster aggregate |
| Asteroid impact | 0.02% | - | Best model |
| Alien invasion | 0.00014% | 0.00000025% to 0.1% | Forecaster aggregate |
| Vacuum decay, weird physics | <~1e-8 | - | Best model |
War
Type of estimate: Geometric mean of forecaster probabilities
Probabilities: 20%, 20%, 40%, 25%, 21.5%,
Range: 20% to 40%
Aggregate: 25%
Forecaster comments:
For context, Ukraine war is ~200k deaths over 2 years. WW1 and WW2 were 10M to 100M deaths
Baserate: WW1 and WW2 for last century are already massive wars, giving baserate of 2/100 years. Specific spots: 15% for China/Taiwan leading to a conflict. But it doesn’t necessarily lead to 1M deaths. Say ~40% that it does
For reference, the Ukraine war hasn’t reached 1M/year. I think I was previously higher, but have down based on vibes, and on accounting for 1M/year being a fairly high threshold.
ASI ~40% within 10 years, in that case maybe \~60% due to destabilization. Might be hard to classify instances of misaligned takeover. If no ASI, maybe \~25% idk
20% on China-Taiwan, and 5% on something else.
Rwandan 1994 genocide was ~800k over 100 days
Based on data from 1400 to 2000, the probability of a death rate at least as high in any of the next 10 years if the current year has a lower death rate is 21.5 %.
Natural pandemic
Type of estimate: Geometric mean of forecaster probabilities
Probabilities: 30%, 25%, 24%, 28%, 10%, 21.6%,
Range: 10% to 30%
Aggregate: 22%
Historical baserate: 4 in the last 100 years. COVID, HIV/AIDS, the Hong Kong flu and the 1957-1958 influenza pandemic. The Spanish flu was 1918-1920 and so just before the 100 year threshold. This would give a 1-(1-4/100)10 = 0.335 = 33.5% probability.
We can get a slightly different angle if we look at the number of years over the last 100 years in which more than 0.0118% of the population (this would be 1M given the population predicted for 2029, the midpoint in our prediction period) died of a pandemic. There are 12 such years, but only four changes from not meeting the threshold to meeting the threshold.
Reasons to update downwards: We learnt something from COVID, we have antibiotics and better treatments, we are better than we have been on average over the last 100 years.
Reasons to update upwards: A lot of people might not go for non-pharmaceutical interventions after COVID, increasing risk due to globalization. H5N1 and monkeypox might be plausible pandemics in the horizon, of which H5N1’s death rate isn’t very high. We are also seeing crops of antibiotic resistance pop up.
The unexpected
Type of estimate: Geometric mean of forecaster probabilities
Probabilities: 30%, 20%, 20%, 15%,
Range: 15% to 30%
Aggregate: 21%
Note: This category refers to events not on this list, including those in the appendix.
Forecaster comments:
Initially I was going to say the chance of something not listed causing >1m deaths in a year is probably extremely likely. But then I looked at the top 10 causes of death per the WHO and 1M+/year is basically the top-10 causes of death which are all disease. Looking at the sum of the probabilities above, we get an EV of like ~1, chances of something surprising are somewhat less than that. We could come up with a base rate by analyzing what catastrophes would have counted as black swans in the past.
This actually quite worries me. Bayesianism breaks down when your categories are imperfect, and when you don’t have the correct categories in your hypothesis space.
Probably not thinking of some stuff
Funny that this is one of the highest probability sources of catastrophe for us, despite having really tried to catalog everything that could plausibly go wrong above.
WW3 specifically
Type of estimate: Geometric mean of forecaster probabilities
Probabilities: 10%, 10%, 40%, 12%,
Range: 10% to 40%
Aggregate: 15%
Forecaster comments:
Metaculus has a US-China war by 2035 at 10%, a Russia-NATO war also at \~10%. Conditional on those maybe 50% chance of world-war level deaths (10m+). Metaculus also has a 20% of WW3 by 2050
7% for China-Taiwan, 4% for other stuff? Not super sure.
I’m at >50% for a US-China war within the next ten years, though this doesn’t necessarily count as WW3?
Nearly all of it on US-China-Taiwan, attaining WW2 (10m deaths+ levels).
AI
Type of estimate: Geometric mean of forecaster probabilities
Probabilities: 10%, 1%, 40%, 16%, 2%, 35%,
Range: 1% to 40%
Aggregate: 9.7%
Forecaster comments:
Per Metaculus, 5% chance of killing 10% of humans by 2100, and 50% of catastrophes happen by 2035. It also has 25% of 1k deaths or $200b damage by 2032
I oscillate a bunch between 0.2% and 20%; maybe I should just poll myself and geom average them.
P(ASI in 10 years) = ~.4. P(1M deaths due to AI | ASI) = ~.7 (assuming AI-powered wars count in addition to e.g. misuse and takeover scenarios) P(1M deaths | no ASI) = .2 (e.g. AI-powered war or misuse; is more likely if we get somewhat close to ASI).
Note that this overlaps with the probability of war as well.
Still not sure about intended interactions between AI and other stuff, like I think war is somewhat likely due in large part to ASI. And this further overlaps with the AI row, not sure whether AI-caused wars count there
Superintelligence soon and quite dangerous
See also: Samotsvety’s AI risk forecasts, Update to Samotsvety AGI timelines
Unintentional biochem
Type of estimate: Geometric mean of forecaster probabilities
Probabilities: 10%, 2%, 0.8%,
Range: 0.8% to 10%
Aggregate: 2.6%
Biorisk is pretty big in general Previously only New drugs, failed biotech intervention, contaminant in food or water supply, now separated into two categories
Vibes
Biological weapons
Type of estimate: Geometric mean of forecaster probabilities
Probabilities: 2%, 2%, 2.5%,
Range: 2% to 2.5%
Aggregate: 2.2%
Forecaster comments:
Metaculus has a ~0.5% forecast for biological catastrophe (not necessarily weapons) causing 100s of millions of deaths/yr. This could theoretically be higher than the war forecasts because it also includes accidental release of bioweapons, but probably not.
The history of biological weapons is much wilder than I expected
In 1346, during the siege of Caffa (now Feodossia, Crimea) the attacking Tartar Forces (subjugated by the Mongol empire under Genghis Khan more than a century earlier), used the bodies of Mongol warriors of the Golden Horde who had died of plague, as weapons. It has been speculated that this operation may have been responsible for the advent of the Black Death in Europe
Possibly this lead to the 25M black plague deaths Modeling this a beta 3 2K leads to a 0.004 to 0.03 probability, or an avg of ~1.5%, over ten years. This seems about right.
Absurd kinds of bio attacks become possible with (narrow) AI, like alpha fold. International taboo against bio weapons is strong and will grow stronger, but fringe / terrorist groups getting their hands on them is the main risk.
Climate change
Type of estimate: Geometric mean of forecaster probabilities
Probabilities: 5%, 1%, 3%,
Range: 1% to 5%
Aggregate: 2.5%
Forecaster comments:
I think impacts from climate change could be hard to disentangle from issues related to unsustainable practices and bad luck.
The WHO anticipates 250k additional deaths/year by 2050
The most pessimistic models don’t really account to adaptation. On the other hand, I could imagine increased migration flows and conflicts caused by drought and un-liveability caused by climate change. Dams are already starting to be a source of conflict. We are also seeing increased temperatures changing the spread of mosquitoes and tropical diseases like dengue, malaria or West Nile virus; this is also worrying.
Volcanoes
Type of estimate: Best model.
Range: 0.2% to 2% per decade.
Historical baserate: Some large historical eruptions over the last several thousand years which are relevant here—taken from this Wikipedia list are: Mount Tambora, 1815, Krakatoa, 1883, Santa María, 1902, 1808, unknown, ~1665, Papua New Guinea, Huaynaputina, 1600, Quilotoa, ~1280, Paektu, 946, unknown, 536 (may have inspired Fimbulwinter), Vesuvius, 76 AD, etc.
It’s kind of tricky to turn these eruptions into a baserate, because a) most of these probably didn’t cause 1M deaths (though the 536 eruption probably did), b) the world was less populated then than it is now, c) death tolls usually report only immediate deaths in the region, but we may also care about deaths due to famine, d) the historical record is much spottier before, say, 1800, e) the biggest volcanic eruptions were before 1800, f) the very biggest are probably prehistorical
We could proceed in a variety of ways. First, we could directly make a judgment call, and say there have been between 3 and 10 eruptions over the last 2000 years that, if they happen now, would kill a million people. That’s a 0.15% to 0.5% chance per year, or 1.5% to 5% per decade.
Second, we can look at the last eruption that might kill 1M people if happened today. That might be the 1815 Tambora eruption. Per Laplace’s rule of succession, you would have a 1/(2024-1815) = 0.00478 = 0.478% chance of such an eruption happening a year, or around a 4.7% chance of happening a decade. Say it would then have a 10% to 50% of killing over 1M people. That’s then 0.47% to 2.35% chance of killing over 1M over a decade.
Third, we could take the frequency of eruptions of a certain magnitude—e.g., a volcanic eruption index of 6 or 7, and attempt to estimate whether one such explosion would kill over a million people. However, this gets a bit messy.
VEI 6 eruptions happen every 50 to 100 years. The share of the Earth that would be urban enough for this to have a large death toll is around 0.3% of the whole of Earth’s surface, or about 1% of the land. Even if you have an eruption near an urban agglomeration, you could still evacuate it beforehand, but say there is a 5% to 25% that you don’t get enough advance warning or otherwise can’t. Multiplying these numbers through results in a 0.0066% to 0.038% of a VEI 6 eruption directly killing over 1M people over the next decade. The intuition is that large urban agglomerations are a small share of total land area, and elsewhere you can’t get enough density to directly cause a large enough death toll.
Let’s sanity check that by looking at a list of large cities around volcanoes: Tokyo, Mexico City, Manila, Jakarta, Naples and Seattle are the most prominent examples, and let’s multiply that by a factor of 1.5 to 5, so say, 9 to 30 volcanoes within ~100km of dense enough urban areas (this includes both cities in that list that have more than one volcano, and additional cities with a density above 1M people in a 100km radius that I’m forgetting about). There are on the order of 500 to 1.5K volcanoes, so we might estimate the change of the next VEI 6 explosion hitting within 100km of a very large city as (9 to 30)/(500 to 1500) = 0.84% to 4.29%. This includes our previous estimate of ~1% of urban areas.
VEI 7 eruptions happen every 500 to 1,000 years. Their frequency is lower but their reach is wider; say they’d have a 2% to 5% chance of large effects reaching an urban agglomeration, a 10% to 50% of doing so fast enough that resident’s can’t evacuate. Irrespective of whether they are very near to an urban area or not, say they’d have a 5% to 30% of causing wide-ranging turmoil and disruption over a larger area, leading to 1M deaths that way. This gives us a 0.077% 0.46% chance per decade of killing over 1M people.
Adding these gives us a (0.0066% 0.038%) + (0.077% 0.46%), or 0.094% to 0.48% chance per decade. Most of the risk comes not from the risk of an eruption being near a city, but from the uncertain damage of very large but very infrequent eruptions.
This is 5x to 35x smaller than our previous estimate of 1.5% to 5% per decade, but it feels more grounded. In particular, after considering just how large the Earth is, and how infrequent large eruptions are, the upper end of our initial 1.5% to 5% range seems too high. Specifically there probably haven’t been 10 historical eruptions over the last 2K years that, if they happened now, would kill over 1M people. The interval might be more like 0 to 4, corresponding to an estimate of 0% to 2% per decade. Looking at our VEI estimates, we could, as a judgment call, stretch our final estimate to 0.2% to 2% per decade.
Reasons to update upwards: The world in general is much more dense now, particularly around Indonesia, which has many volcanoes.
Reasons to update downwards: No volcanic eruption has killed close to 1M people in recent memory, we are better at both forecasting and at damage mitigation now than we have ever been, volcanic risk is easy to explain. One mechanism volcanoes caused death in the past is through famine, but we are producing much more food today.
It might be illustrative to contrast this with an estimate from The Precipice: ~1 in 10K for the next 100 years, or ~0.001% for a decade. This might be so much lower because Ord is looking at Supervolcanoes (VEI >8), which are historically much rarer. In contrast here we are looking at eruptions with VEI of 6-7. Note that a one in a millennium eruption together with a once in a century plague, like the Plague of Justinian still wasn’t enough to cause existential risk (humans aren’t extinct yet), though the ensuing little ice age could arguably be categorized as a catastrophic risk.
See also: Supervolcanoes tail risk has been exaggerated?.
US civil war
Type of estimate: Geometric mean of forecaster probabilities
Probabilities: 2%, 0.50%, 3%, 2%, 0.05%, 2%,
Range: 0.05% to 3%
Aggregate: 0.92%
Forecaster comments:
Base rate 1/300. I think we’re not near levels of division 10 years before the civil war?
1/300 for base rate = 0.33%, times ten years ~ 3%. I’m not sure if this is a 2% or a 5%; both seem kind of plausible depending on a definition of civil war. But then, 1M deaths in any one year is a huge threshold, so I’m going down to 0.5%.
Could happen with AI with extreme change, but still unlikely (expect there to be one dominant US ASI)
Some of the Trump plans (e.g. sending the National Guard into Democratic-leaning states to deport migrants) heighten the risk of a US civil war. Base rate is ~0.4% for a civil war starting in any particular year.
US is a basket case, sorry guys
Financial crisis (e.g., hyperinflation)
Type of estimate: Geometric mean of forecaster probabilities
Probabilities: 0.5%, 2%, 0.6%, 0.2%,
Range: 0.2% to 2%
Aggregate: 0.59%
Forecaster comments:
Trump has made statements on wanting to roll back the independence of the Federal Reserve. Destabilization of the dollar could also cause ripple effects throughout the entire world.
Very difficult to measure indirect deaths caused by economic events! I tried to research excess mortality after major historical economic events. US Great Depression might have actually increased life expectancy?! The collapse of the Soviet Union (not primarily a financial crisis, but at least in part) led to an estimated 3M excess deaths over 10 years in Russia only, higher after counting other former Soviet states.
Initially I was surprisingly high on Weimar-style hyperinflation specifically: Spending is much more politically popular than austerity. US is racking up debt. Much more politically feasible than taxes. On the other hand, causing 1M deaths is a pretty high bar. 15% for a financial crisis happening at all, 2% on excess deaths. I should look more into Sri Lanka, where my impression was that financial mismanagement led to hunger
Just ‘hyperinflation’ due to central bank mismanagement can not lead to 1M deaths. It is not a ‘real’ problem, only a ‘nominal’ problem, and while there will be hardship, it won’t kill. But if something like the USG failing to honor debts is considered a ‘financial crisis’, then the fallout can be much greater. 1M deaths are plausible.
Solar storm
Type of estimate: best model
Estimate: 0.00066% to 0.71% per decade.
Historical baserate of the event happening at all: The Sun has an around a 22 year Hale cycle, with notable storms in 1859, 1872, 1882, 1903, 1921, 1938, 1957, 1959, 1989, 2003, 2024. We also have more detailed geomagnetic data from 1957.
From here, we could produce a few types of base rates:
On the one hand, one could fit the more recent data to a distribution, and try to extrapolate what the tails of that distribution might be, as GiveWell/Open Philanthropy’s David Roodman does here. He arrives at a probability of 0.7% per decade of seeing a storm as big as the 1859 Carrington event, and a 95% range of 0.0… to 11.9% per decade. This 0.7% would give an ex-ante probability to the Carrington event in the last 165 years of 1-(1-0.7%/10)165 = 10.9%. If we take this approach, we are essentially saying that there is a lot of information in the middle of the distribution about the tails of the distribution, and. Per this modeling approach, we should be surprised to have seen the Carrington event, and some of that surprise carries through into estimating a lower probability for events like it going forward.
On the second hand, we could instead look at the latest storm in 1859, and estimate from its distance to the present how likely such an event is, using a doomsday argument, Lindy effect or Laplace’s rule of succession type argument.
Per a Lindy effect/doomsday argument-type argument, we can say that if 165 years have passed since then, there is about a 50% chance that we won’t see such a strong event in the next 165 years, and a 50% chance we will. This 50% per 165 years would correspond to p=1-0.51/165 = 0.42% per year, and 1-(1-p)10 = 4.1% per decade
Per a Laplace rule of succession we can say that the probability per year is 2/(2024-1859 + 2) = 1.25% per year or 11.3% per decade. A few years ago, in 2017, this would have instead been 11.8%, or the ~12% that Open Philanthropy’s Roodman was railing against.
If we also include the May 1921 geomagnetic storm, the probability would be even higher. Per decade, we would arrive at a 6.5% chance from a doomsday-type argument, and 17.2% from a Laplace-type argument.
On the third hand, we could look deeper into the historical record, hope that the reconstructions are correct, and arrive at a 0.7% chance of a Carrington level event per year, or at modeling it as a 1 in 151 years event. This would correspond to a 6.4% chance per decade.
Samotsvety forecasters chose the Laplace/Lindy type argument or the extrapolation from the longer-term historical record method.
Conditional on a big storm, the effects are uncertain. Here is an older literature review on the topic.
Reasons to update upwards: The world is significantly more electrified, we rely on satellites more. In past incidents, the electrical grid did show the kinds of failures that might be exacerbated by a storm of a much greater magnitude, and the Sun also produced some near misses.
Reasons to update downwards: The peak of the current solar cycle is about halfway over, response for the May 2024 storm was competent and incorporated lessons from 1989, 1M is a lot of deaths.
Overall it makes sense to have a strong adjustment factor between a storm as large as or bigger than 1859 happening and 1M deaths, but it’s unclear if it would be something like 1 in 10k or something like 1 in 10. Multiplying 4.1% to 11.3% by 0.01% to 10% gives us a 0.00066% to 0.71% chance per decade of 1M people perishing as a result.
Simulation shutdown
Type of estimate: Geometric mean of forecaster probabilities
Probabilities: 1%, 0.1%, 3%, <0.001%,
Range: 0.001% to 3%
Aggregate: 0.13%
Forecaster comments:
Bostrom’s simulation argument is interesting but ultimately I don’t buy it as a practical matter
I have >50% p(simulation), and this is a super important time in history. We might get ASI then shutdown
Unfalsifiable! I will add more zeros. What are you gonna do about it? :P
Asteroid impact
Type of estimate: best model
Estimate: ~0.02% per decade.
Historical baserate: Wikipedia has this list of frequencies of different airburst sizes. These are sourced from a figure on the very last page of this paper.
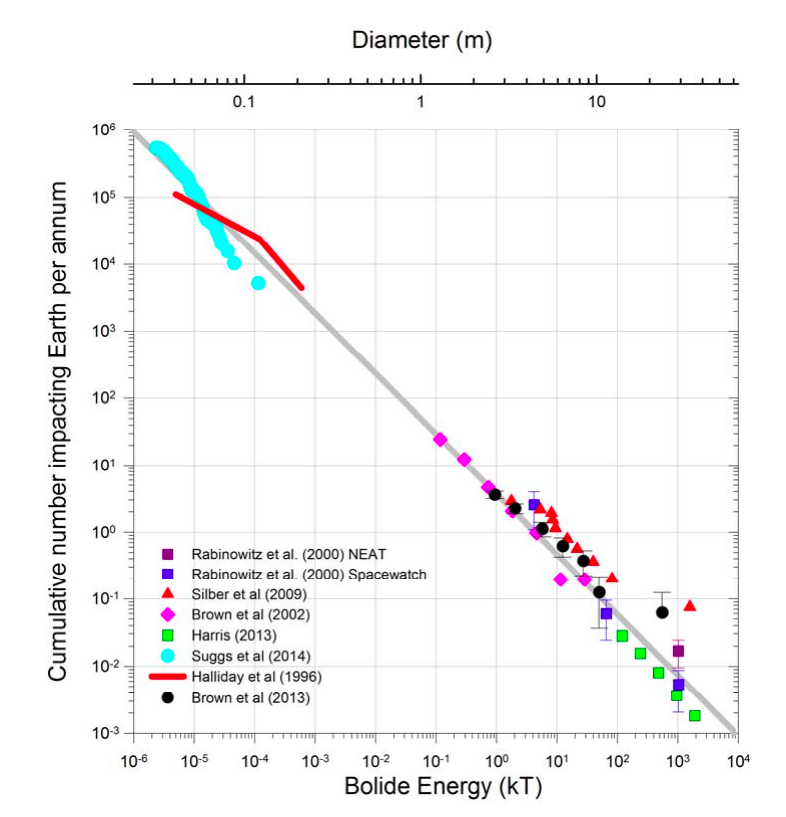
18m is like the Chelyabinsk meteor, which caused ~1.5K injuries and damaged ~7K buildings but probably no deaths. The Tugunska event of 1908 instead had 50-60m, but caused only three deaths because it was over a sparsely populated area; it still affected 2.1K km2 (or about two NYCs worth). We can probably detect and deflect larger asteroids and larger asteroids are much less frequent. So it feels like the sweet spot is on smaller asteroids that are hard to track but could still do enough damage if they hit an urban enough area.
So say Tugunska level asteroid happens every ~300 years, and it has, generously, a 0.3% chance of hitting an urban enough area. That’s a 0.01% chance in the next 10 years. Say a 100m asteroid happens every 1000 years and has a 3% of hitting an urban enough area, but also a 66% chance of being deflected beforehand, that’s another 0.01%.
Alien invasion
Type of estimate: Geometric mean of forecaster probabilities
Probabilities: 0.1%, 0.00000025%, 0.0001%,
Range: 0.00000025% to 0.1%
Aggregate: 0.00014%
Forecaster comments:
lol no
Running with Tristan Cook’s estimate here.
Vacuum decay, spontaneous black holes, doomsday particles, or other weird physics-based catastrophes
Estimate: <~0.000001%, or <~1e8 per decade
Type of estimate: best model
Bostrom early in his career has a paper which estimates this probability, taking into account anthropic reasoning, based on the age of the Earth: “the cosmic sterilization rate for a habitable planet is at most of order one per Gigayear.”

Conclusion and reflections
Sorting our probabilities by aggregate probability, we see that different types of catastrophes differ in their likelihood by many orders of magnitude: not all catastrophes are in the same order of magnitude for their probability.
| Calamity | Probability > 1M deaths in a year of the next 10 | Range | estimate |
|---|---|---|---|
| War | 23% | 18% to 40% | Forecaster aggregate |
| Natural pandemic | 22% | 10% to 30% | Forecaster aggregate |
| The unexpected | 21% | 15% to 30% | Forecaster aggregate |
| WW3 specifically | 12% | 5% to 40% | Forecaster aggregate |
| AI | 10% | 1% to 40% | Forecaster aggregate |
| Unintentional biochem | 2.4% | 0.8% to 10% | Forecaster aggregate |
| Biological weapons | 2.2% | 2% to 2.5% | Forecaster aggregate |
| Climate change | 2.5% | 1% to 5% | Forecaster aggregate |
| Volcanoes | 1% | 0.2% to 2% | Best model |
| US civil war | 0.92% | 0.05% to 3% | Forecaster aggregate |
| Financial crisis | 0.59% | 0.2% to 2% | Forecaster aggregate |
| Solar storm | 0.2% | 0.00066% to 0.71% | Best model |
| Simulation shutdown | 0.13% | 0.001% to 3% | Forecaster aggregate |
| Asteroid impact | 0.02% | - | Best model |
| Alien invasion | 0.00014% | 0.00000025% to 0.1% | Forecaster aggregate |
| Vacuum decay, weird physics | <~1e-8 | - | Best model |
Sentinel so far has been particularly oriented towards the unexpected. But seeing this table, I’m also struck by how high the probability of war is, and how comparatively neglected it is in our circles.
We were also more bearish on solar flares than we are after this exercise. We do think there is a ~7% chance that we will see a solar flare larger than the Carrington event over the next 10 years, but the probability of it leading to the death of 1M people seems much smaller.
It’s also kind of interesting how there aren’t risks in that table between 10% and 3%. Maybe that’s a failure of the imagination.
Acknowledgements
Thanks to Jonathan Mann, Jack Chen, Eli Lifland, Vidur Kapur, Chinmay Ingalavi & Tolga Bilge for contributing probabilities and models to this article. I (Nuño) also provided probabilities, and wrote up the models based on forecaster comments and my own research.
Thanks also to Vasco Grilo for pointers to Roodman’s model of asteroid risk and to a pointer on historical pandemic deaths as a share of the population. Thanks to Tolga Bilge for pushback on models of physical catastrophes. Thanks to Misha Yagudin and Rai Sur for various comments and suggestions.
Appendix
Shortcuts taken
For small p, we estimated 1-(1-p)n as n * p. You can justify this by looking at the Taylor expansion. Sometimes when the probability is high enough we do bother with the longer expansion.
When using Laplace’s rule of succession, instead of having
$$ 1-\left(1-\frac{successes+1}{trials+2}\right)^n $$
One really ought to have
$$ 1-\frac{failures + 1}{trials+2}\cdot\frac{failures + 2}{trials+3}\cdot...\frac{failures + n + 1}{trials+n+2} $$
That is, if it doesn’t happen the first year, one has gained some information and probably ought to model the probability in the next year as being lower. But if n << trials, this doesn’t matter much.
When giving ranges, sometimes we model these as lognormals rather than by fitting a beta distribution.
Other items we might have forecasted
Towards the end of the exercise, forecasters became more laconic. If they’d had infinite energy, it might have wanted to forecast on…
- Large regional conflict
- Nuclear war
- Widespread civil disorder
- Social hazard
- Ecosystem collapse, famine
It might have also been interesting to look at multi-factor catastrophes, or into demographic collapse if people converge to not having many kids.
- Ranges represent either the lowest and highest probabilities given by forecasters, or the 90% confidence interval if using a model.↩